


World
If you use any of the illustrations on this page, please clearly indicate the source below.
JCDP (https://jcdp.jp/)
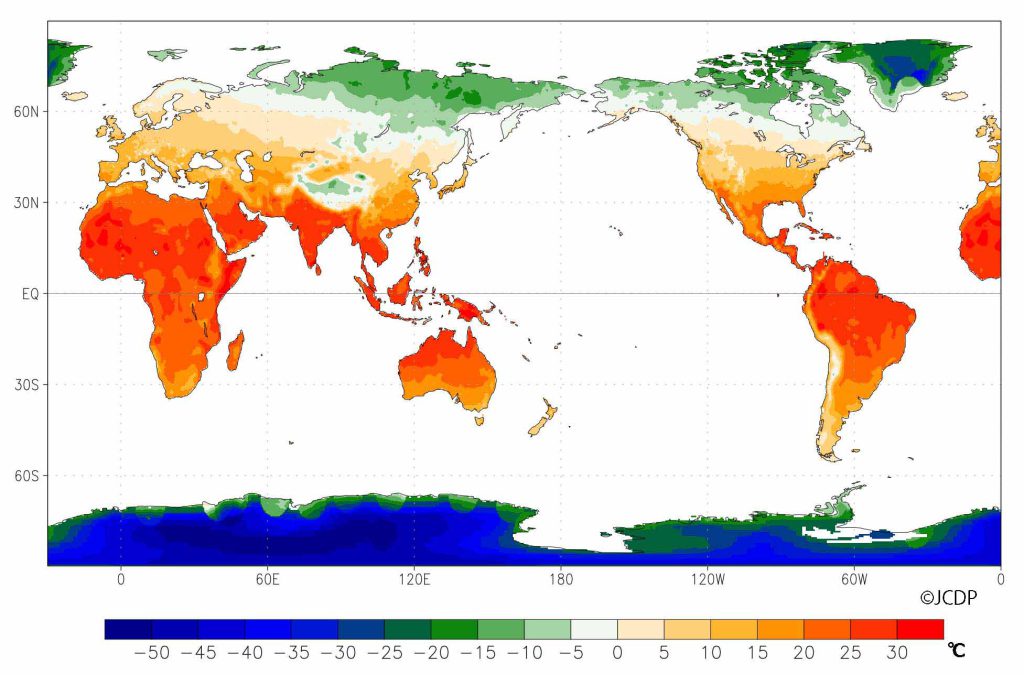
Annual Mean Air Temperature (Land) : 1981-2010
The data was acquired from GHCN Gridded V2 data provided by the NOAA/OAR/ESRL PSL, Boulder, Colorado, USA, from their Web site at / https://psl.noaa.gov/data/gridded/data.ghcncams.html
The figure was created using GrADS (The Grid Analysis and Display System).
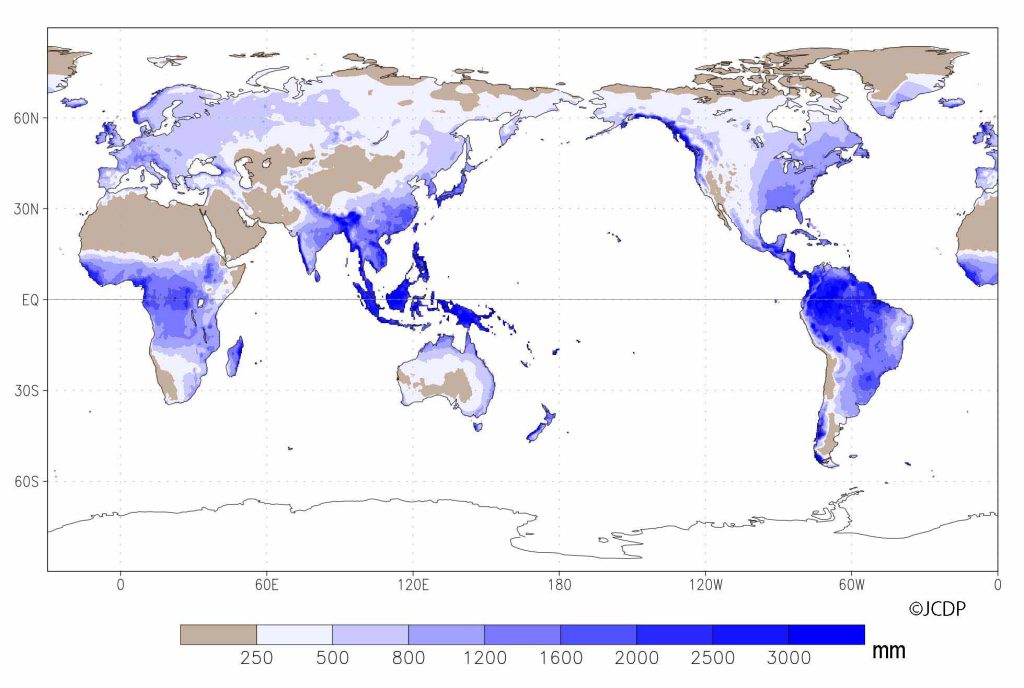
Annual Mean Total Precipitation (Land) : 1981-2010
The GPCC Precipitation data is provided by the NOAA/OAR/ESRL PSL, Boulder, Colorado, USA, from their Web site at https://psl.noaa.gov/data/gridded/data.gpcc.html/
The figure was created using GrADS (The Grid Analysis and Display System).
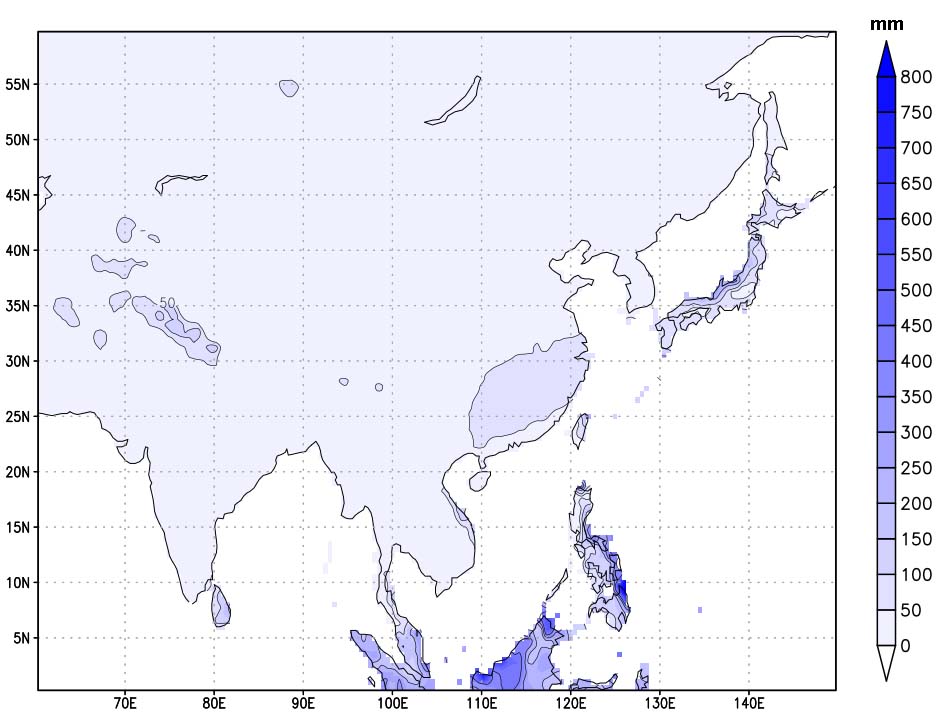
January Mean Precipitation (Land) in Monsoon Asia: 1981-2010
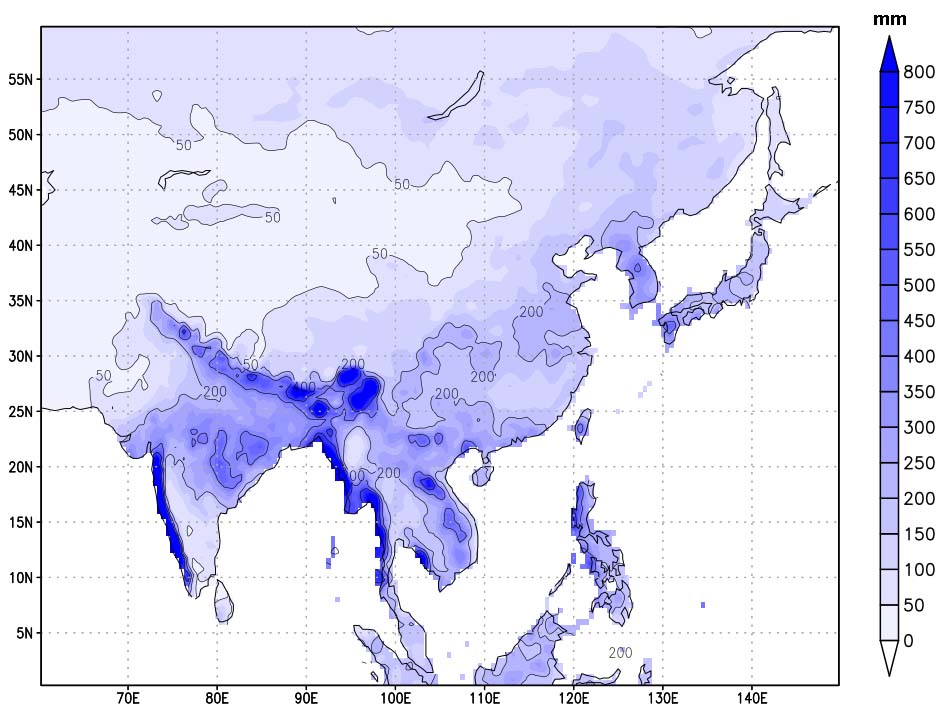
The GPCC Precipitation data is provided by the NOAA/OAR/ESRL PSL, Boulder, Colorado, USA, from their Web site at https://psl.noaa.gov/data/gridded/data.gpcc.html
The figure was created using GrADS (The Grid Analysis and Display System).
July Mean Precipitation (Land) in Monsoon Asia: 1981-2010
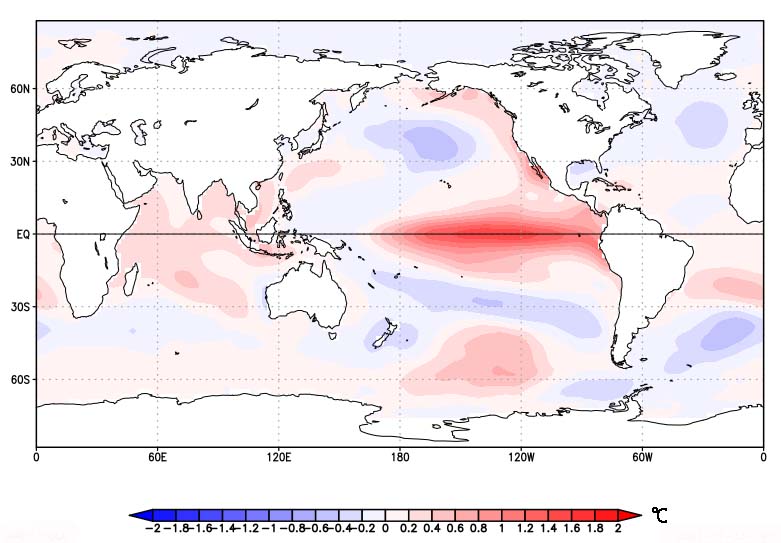
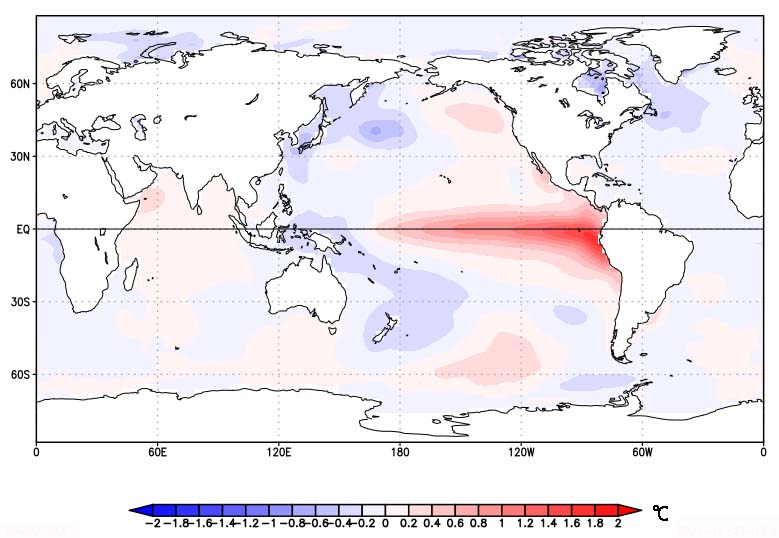
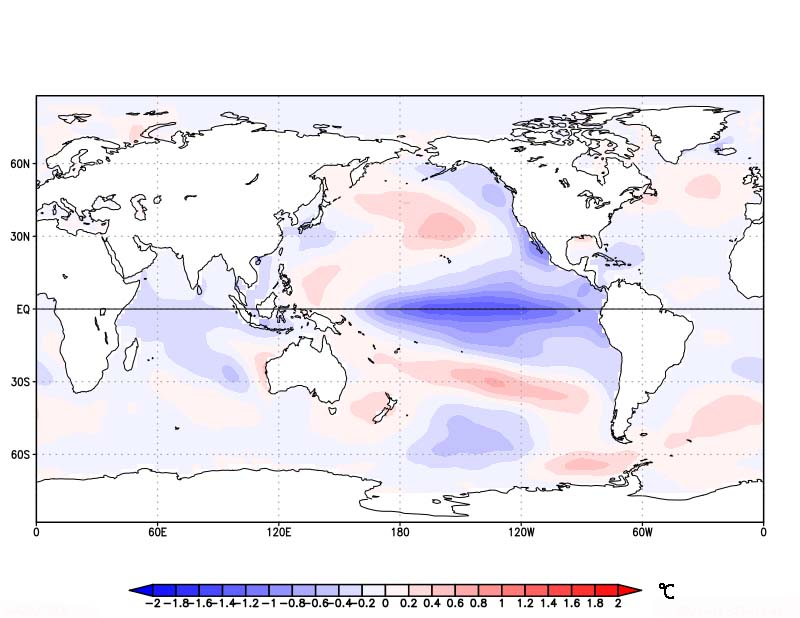
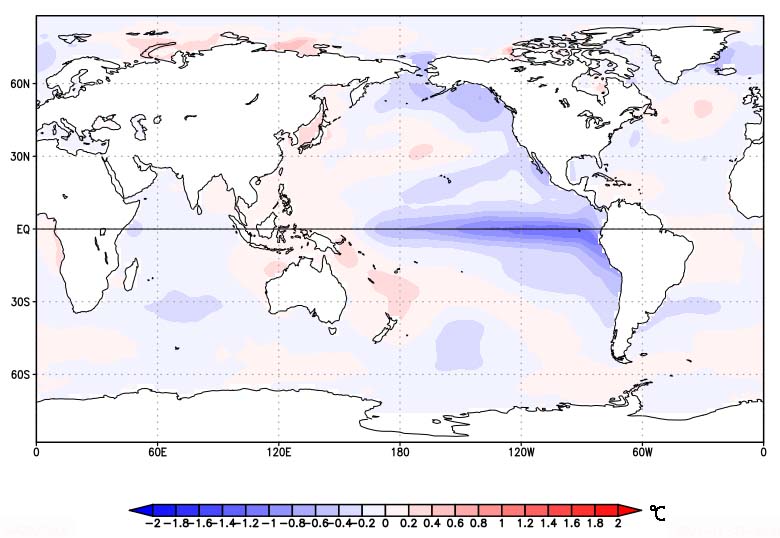
Climate atlas for El Niño and La Niña years
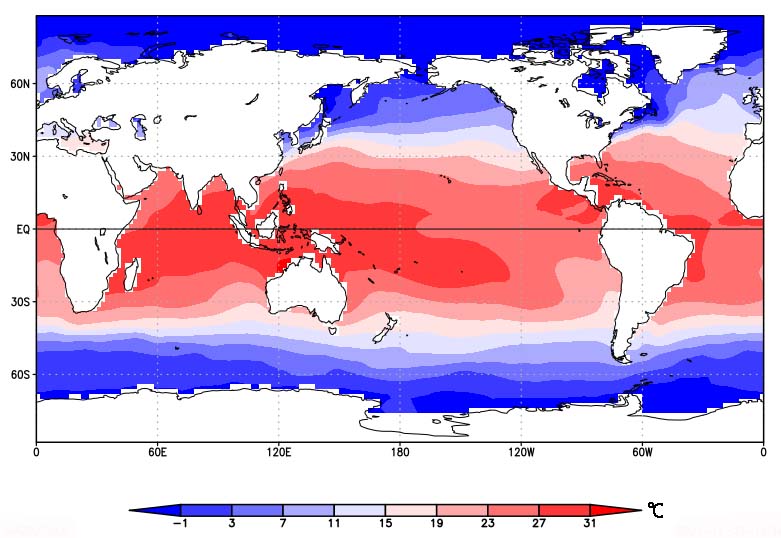
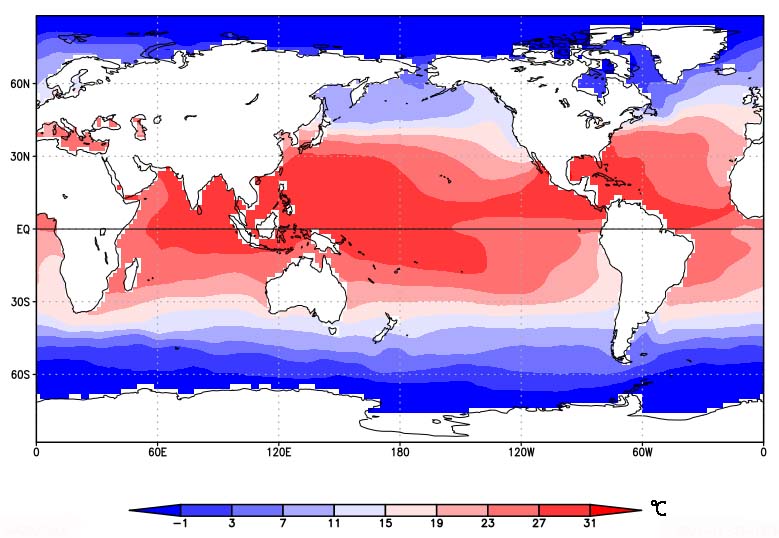
Various climate atlases for winter (DJF: December – February) and summer (JJA: June – August) El Niño and La Niña years (composite mean of differences from 1951-2020 normal) have been prepared and are now available. For reference, we have also included SST distribution maps (1951-2020 average) for winter and summer.
The NOAA ERSST v5 data is provided from their Web site at https://psl.noaa.gov/data/gridded/data.noaa.ersst.v5.html
The figures were created using GrADS (The Grid Analysis and Display System).
El Niño and La Niña years were extracted according to the following JMA definitions.
https://www.data.jma.go.jp/gmd/cpd/data/elnino/learning/faq/elnino_table.html
El Niño years
★Winter DJF: 1951/52,1957/58,1963/64,1965/66,1968/69,1969/70,1972/73,1976/77,1982/83,1986/87,1987/88,1991/92, 1997/98, 2002/03,2009/10,2014/15,2015/16,2018/19
★Summer JJA: 1951,1953,1957,1963,1965,1969,1972,1976,1982,1983,1987,1991,1992,1997,2002,2009,2014,2015
La Niña years
★Winter DJF: 1954/55,1955/56,1964/65,1967/68,1970/71,1971/72,1973/74,1975/76,1984/85,1988/89,1995/96,1999/2000,2005/06,2007/08,2010/11,2017/18,2020/21
★Summer JJA: 1954,1955,1964,1967,1970,1971,1973,1975,1984,1985,1988,1995,1998,2007,2010,2021954,1955,1964,1967,1970,1971,1973,1975,1984,1985,1988,1995,1998,2007,2010,2020
NH Winter (DJF) Mean Sea Surface Temperature (SST) Distribution (1951-2020)
NH Summer (JJA) Mean Sea Surface Temperature (SST) Distribution (1951-2020)
NH Winter (DJF) Sea Surface Temperature anomalies in El Niño years
NH Summer (JJA) Sea Surface Temperature anomalies in El Niño years
NH Winter (DJF) Sea Surface Temperature anomalies in La Niña years
NH Summer (JJA) Sea Surface Temperature anomalies in La Niña years
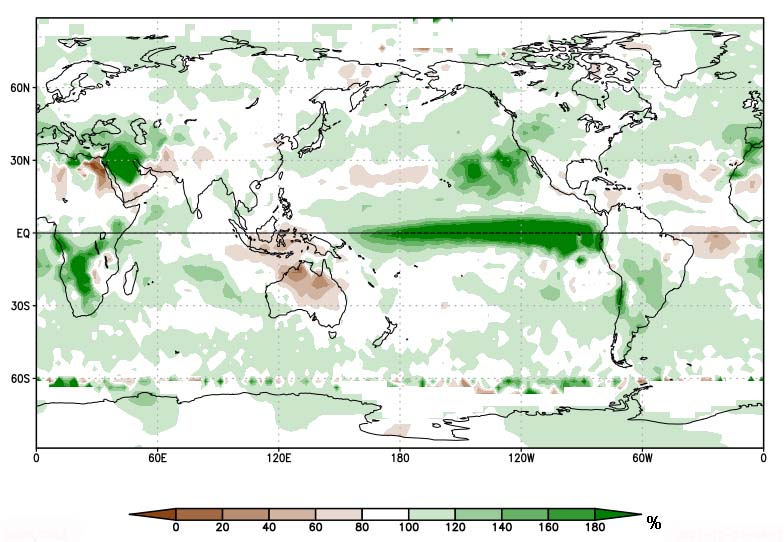
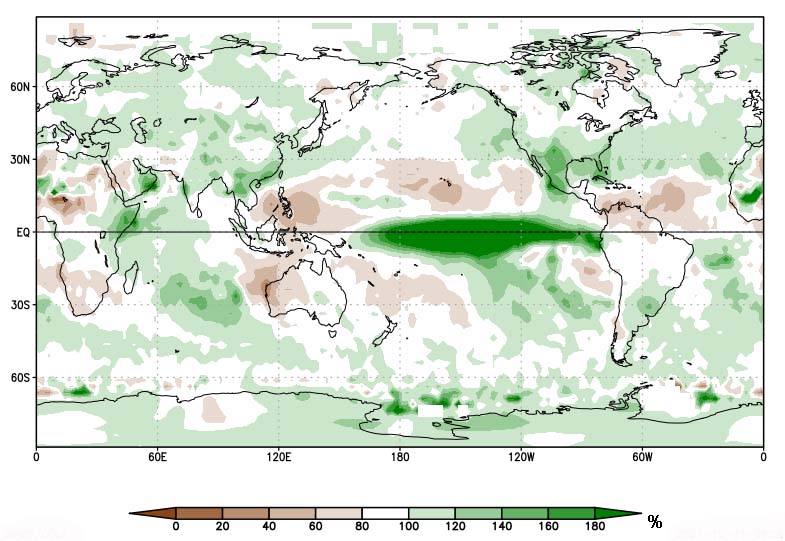
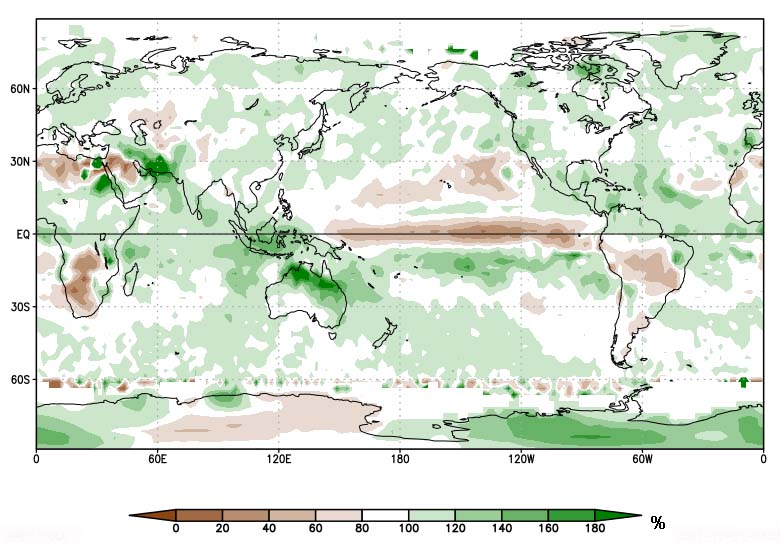
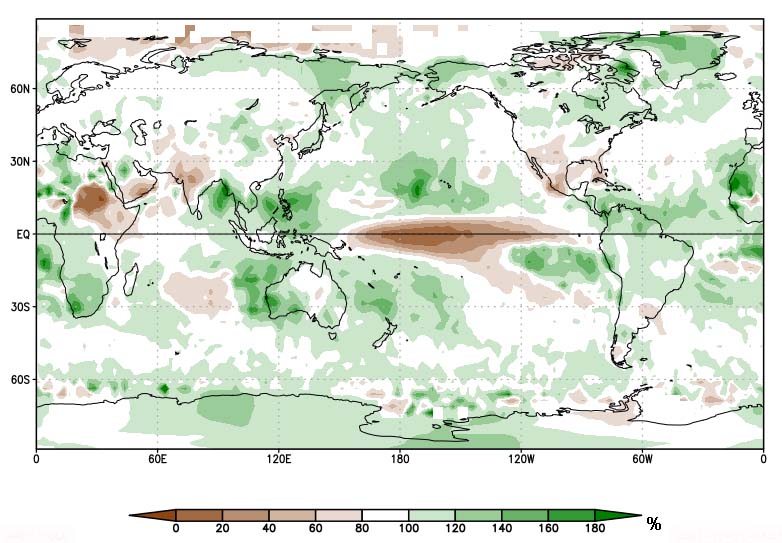
World Precipitation anomalies in El Niño and La Niña years (Reference Period: 1979-2021)
The CPC Merged Analysis of Precipitation (CMAP) is provided from their Web site at https://psl.noaa.gov/data/gridded/data.cmap.html
The figures were created using GrADS (The Grid Analysis and Display System).
El Niño/La Niña years are defined by the Japan Meteorological Agency.
https://www.data.jma.go.jp/gmd/cpd/data/elnino/learning/faq/elnino_table.html
NH Summer (JJA) Precipitation anomalies in El Niño years (Reference Period: 1979-2021)
NH Winter (DJF) Precipitation anomalies in El Niño years (Reference Period: 1979-2021)
NH Summer (JJA) Precipitation anomalies in La Niña years (Reference Period: 1979-2021)
NH Winter (DJF) Precipitation anomalies in La Niña years (Reference Period: 1979-2021)
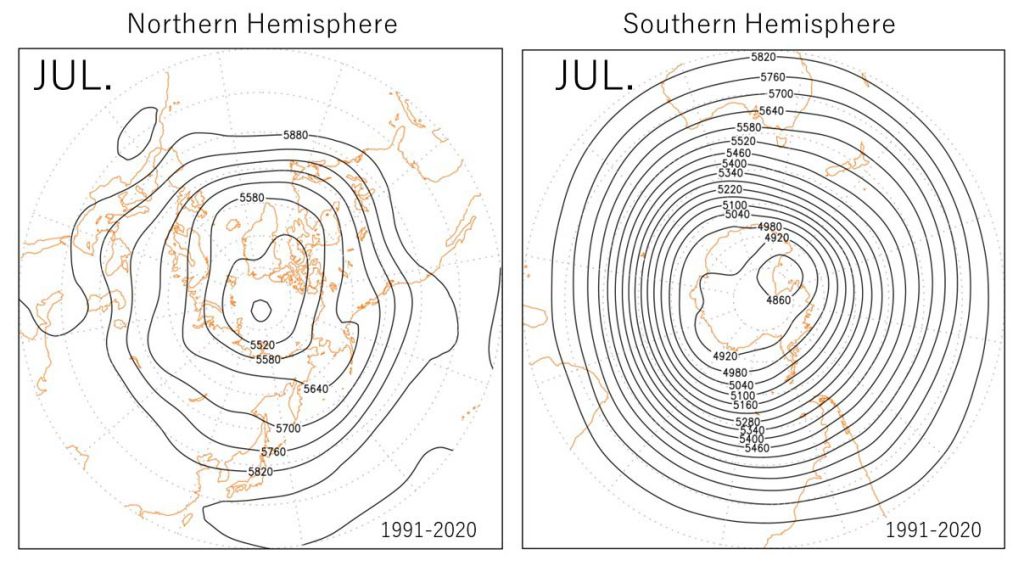
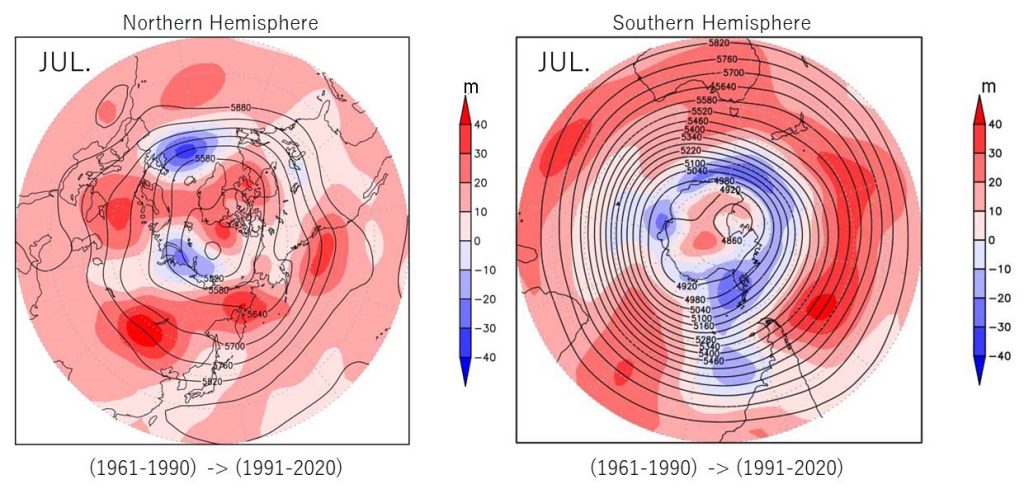
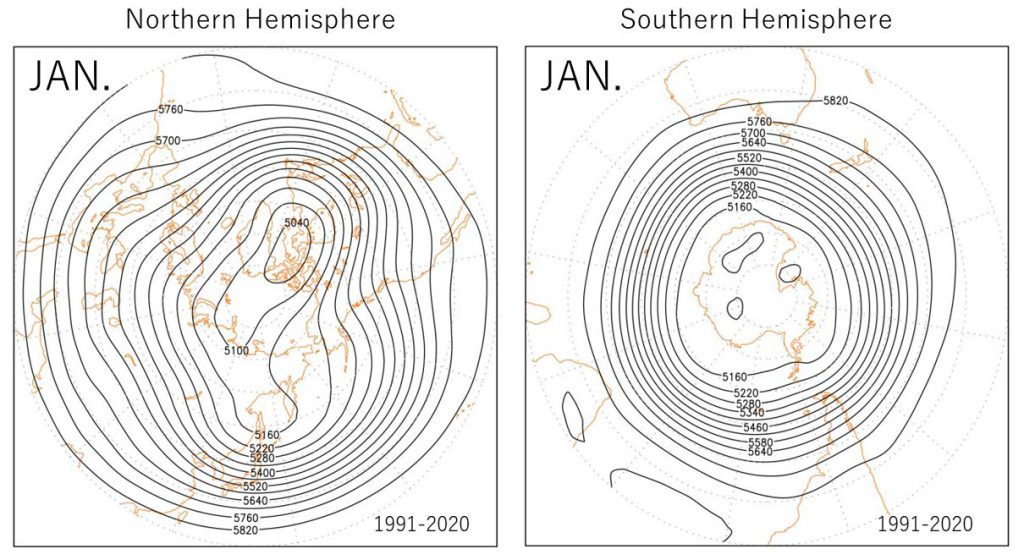
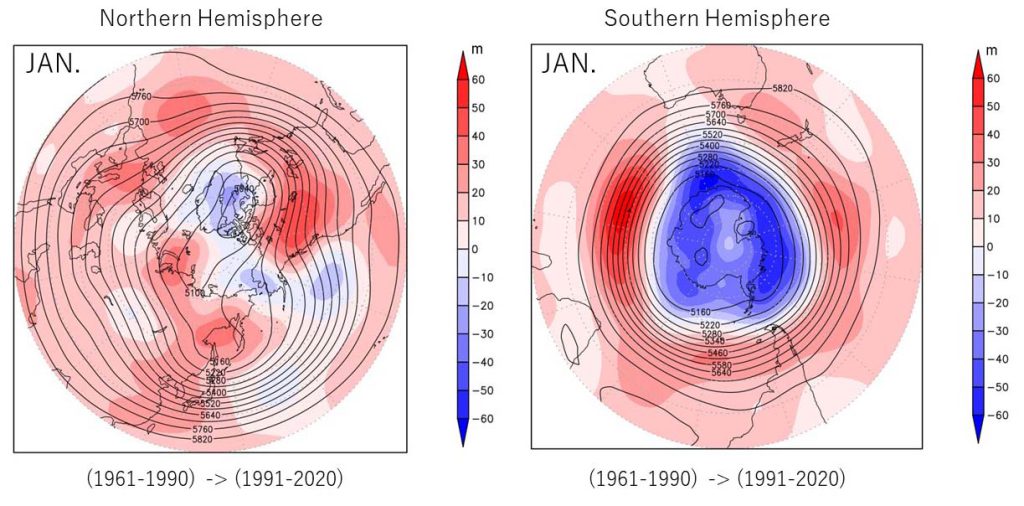
Mean Geopotential Height distribution at 500hPa level of the Northern and Southern Hemisphere in January and July (1991-2020 normal) , and their Changes from 1961-1990 normal
Figures were created using GrADS (The Grid Analysis and Display System) based on NCEP Reanalysis data provided by the NOAA/OAR/ESRL PSL, Boulder, Colorado, USA, from their Web site at /https://psl.noaa.gov/data/gridded/data.ncep.reanalysis.html
Geopotential Height distribution at 500hPa level in January (1991-2020)
Geopotential Height distribution at 500hPa level in July (1991-2020)