


世界
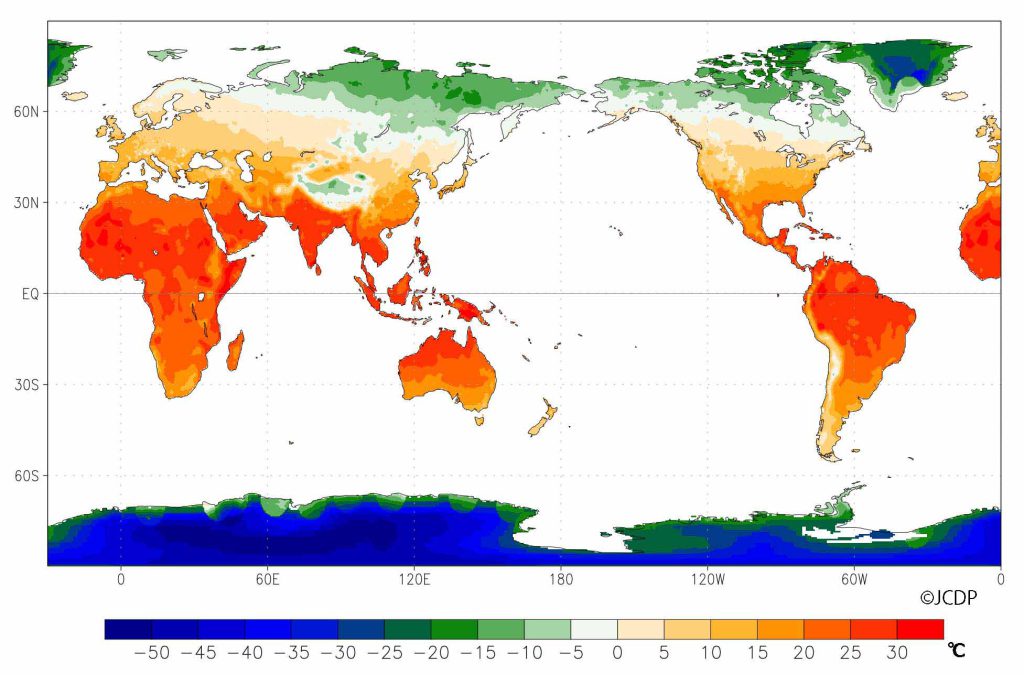
★世界の年平均気温分布(陸上):1981-2010
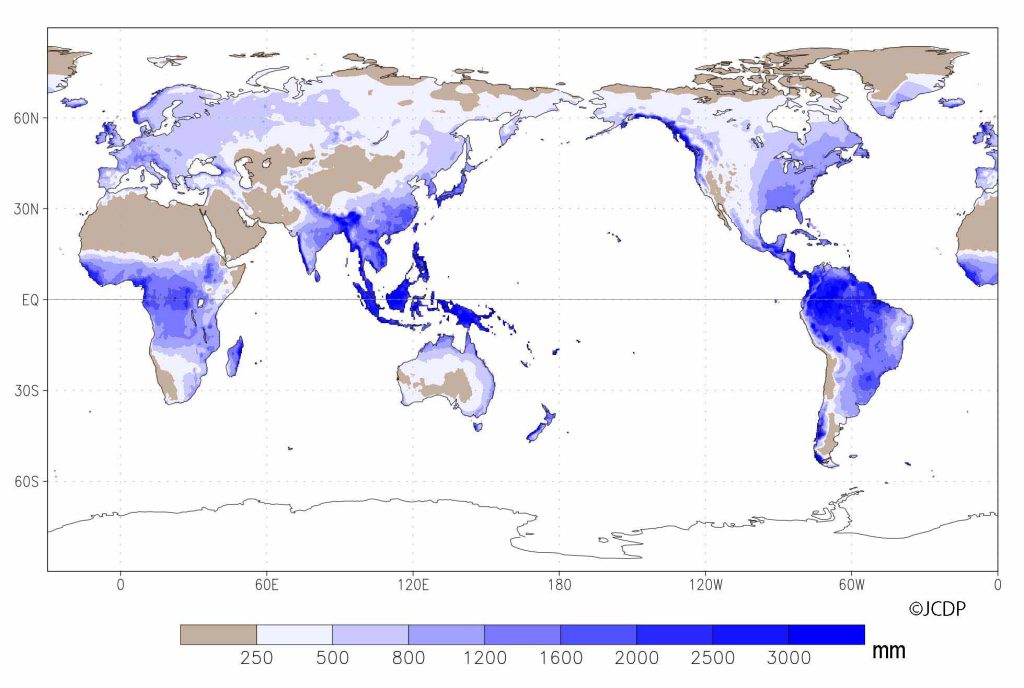
★世界の年降水量分布(陸上):1981-2010
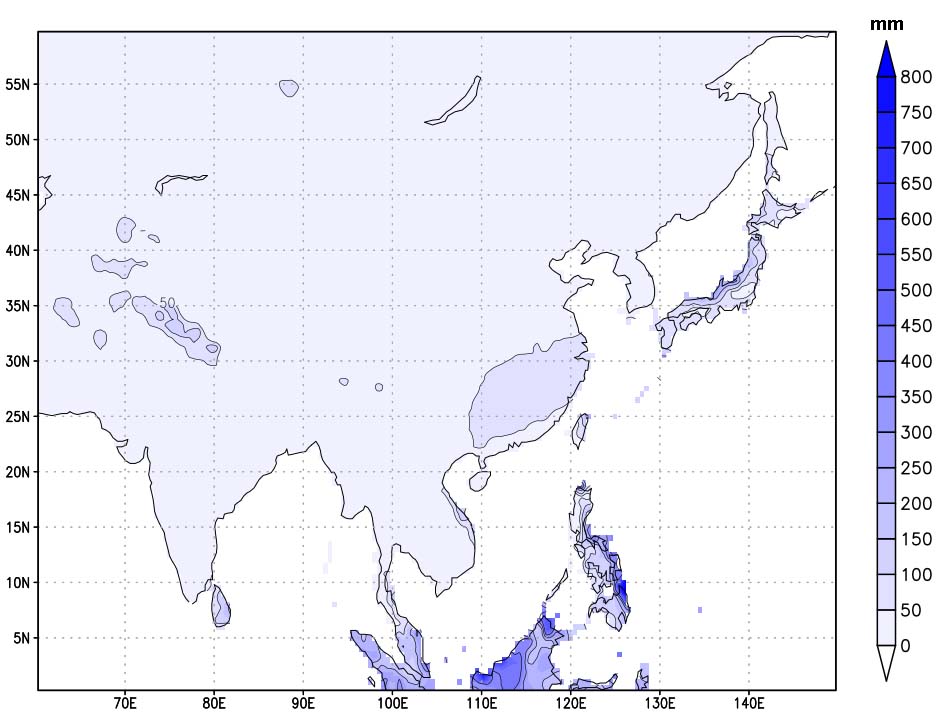
★モンスーンアジアの1月降水量分布(陸上):1981-2010
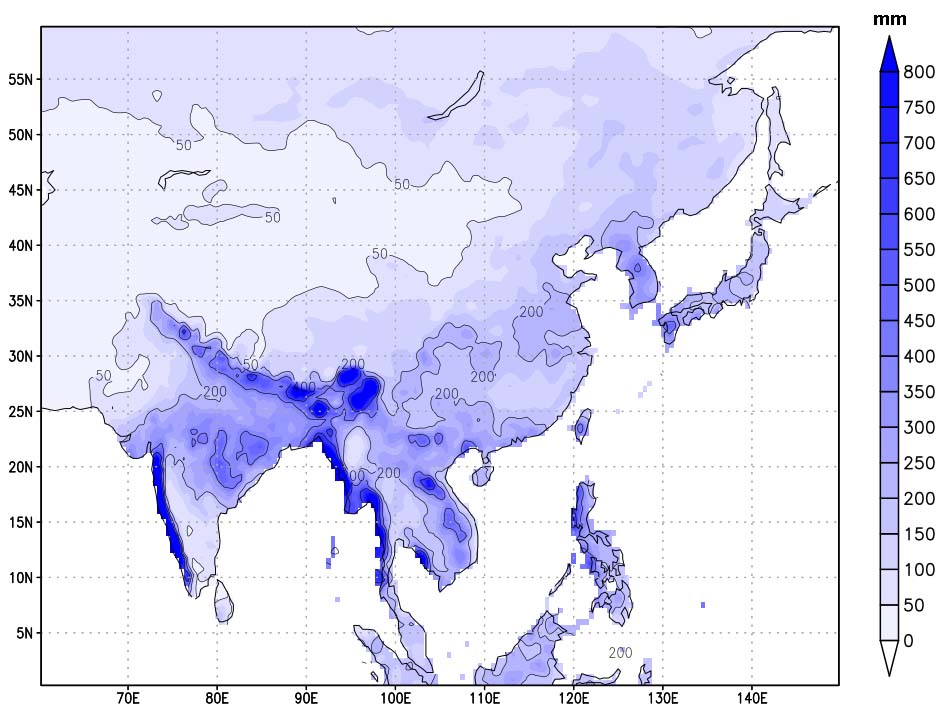
★モンスーンアジアの7月降水量分布(陸上):1981-2010
★エルニーニョ年とラニーニャ年の気候アトラス
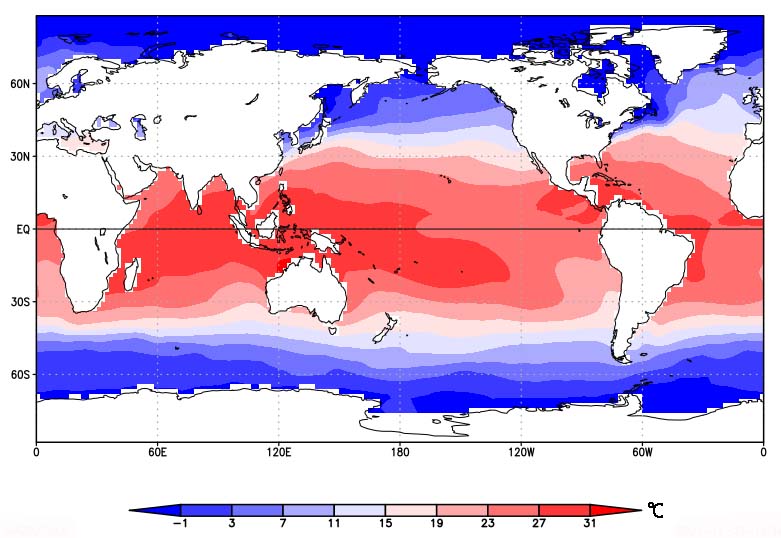
冬季DJF平均海面水温分布(1951-2020)
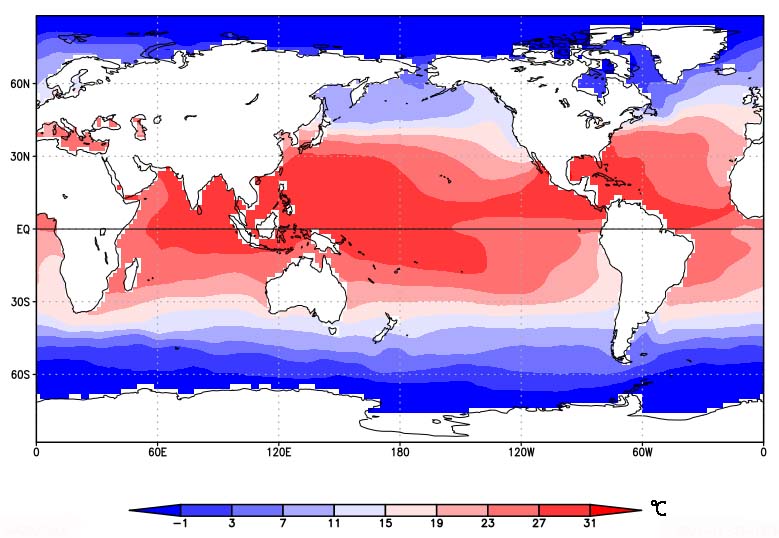
夏季JJA平均海面水温分布(1951-2020)
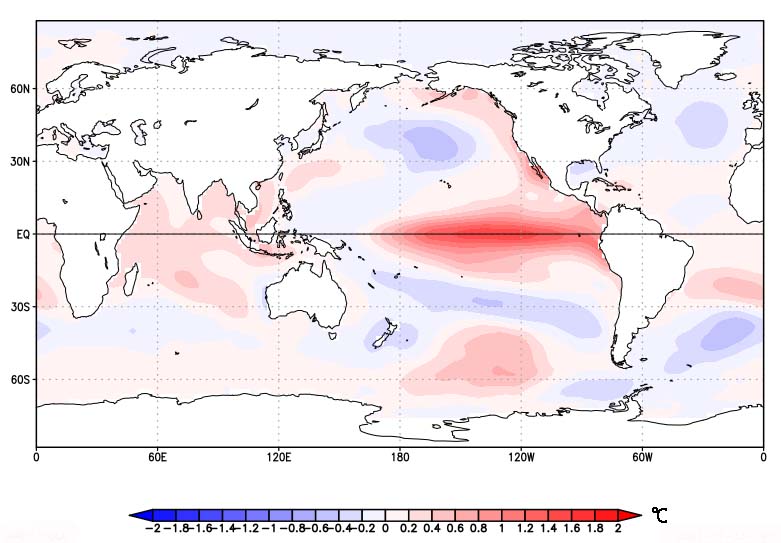
エルニーニョ年の冬季DJF海面水温SST偏差分布
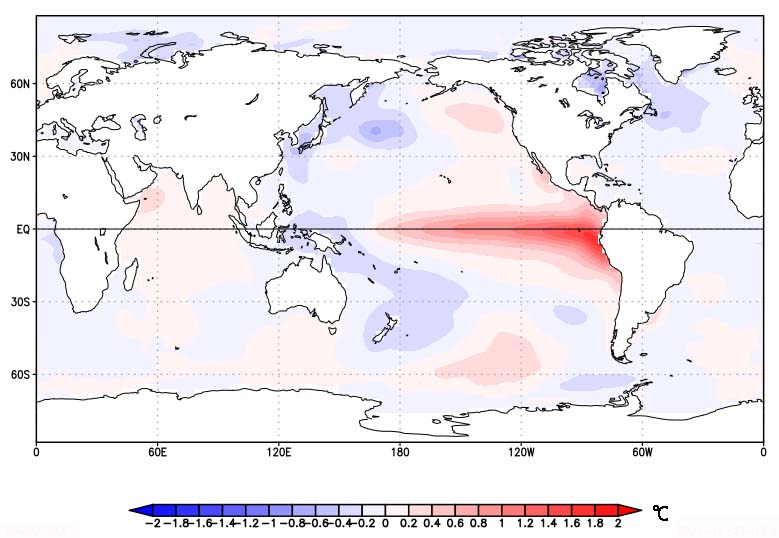
エルニーニョ年の夏季JJA海面水温SST偏差分布
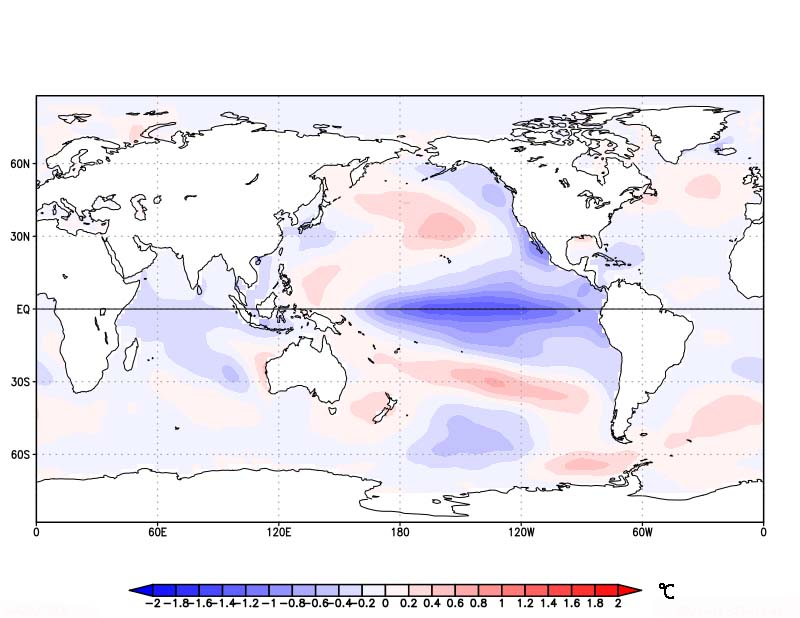
ラニーニャ年の冬季DJF海面水温SST偏差分布
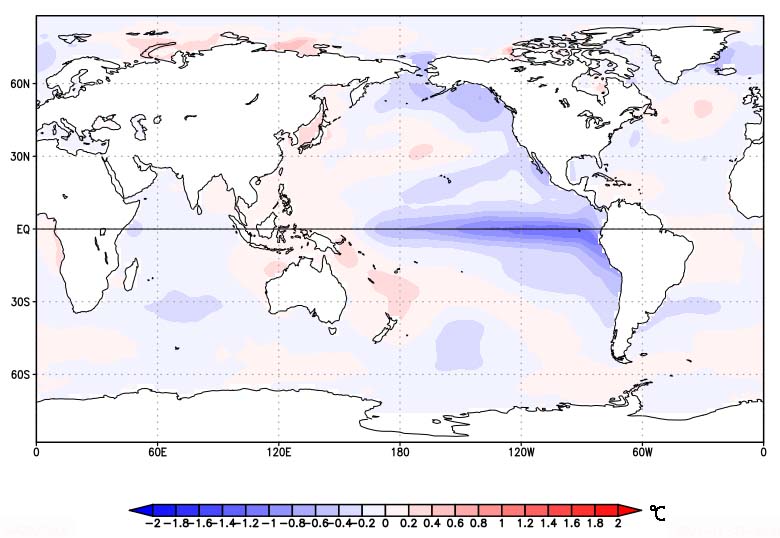
ラニーニャ年の夏季JJA海面水温SST偏差分布
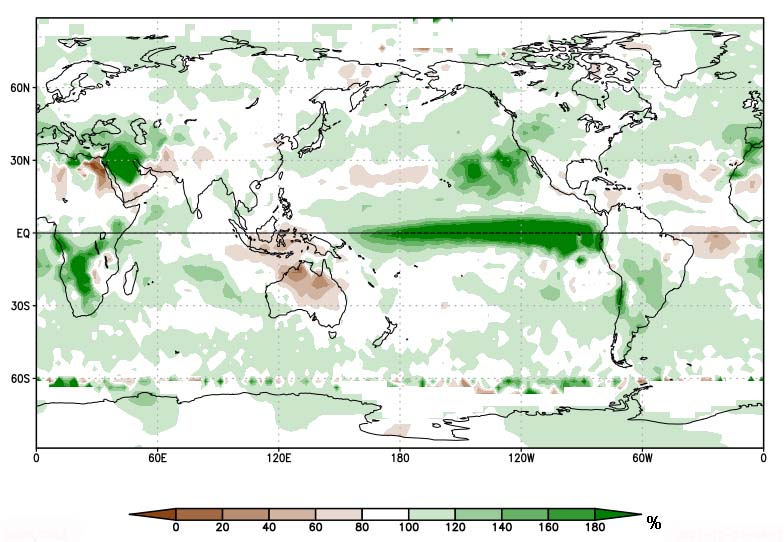
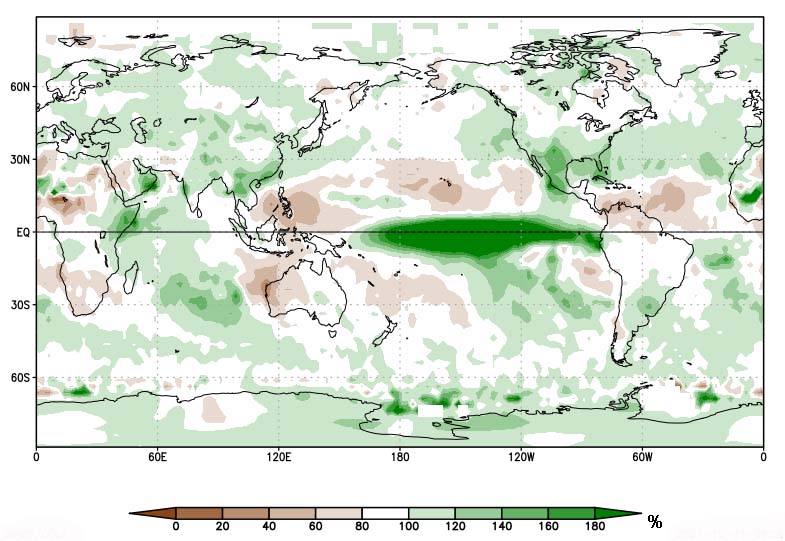
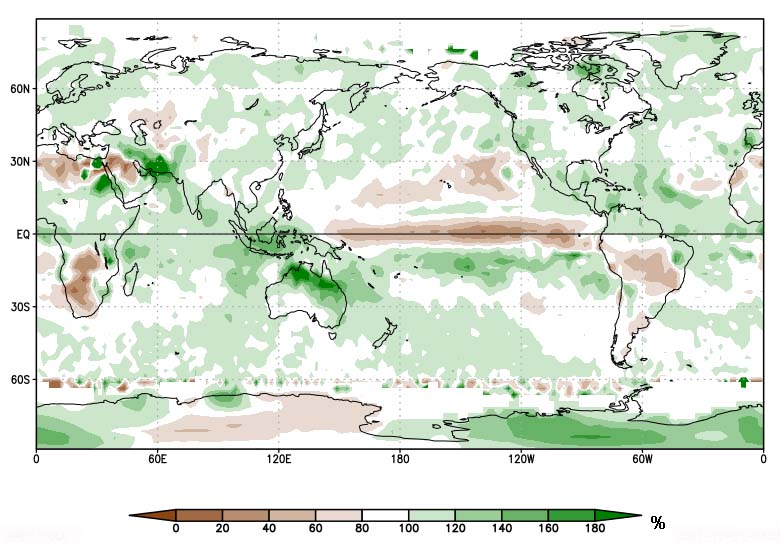
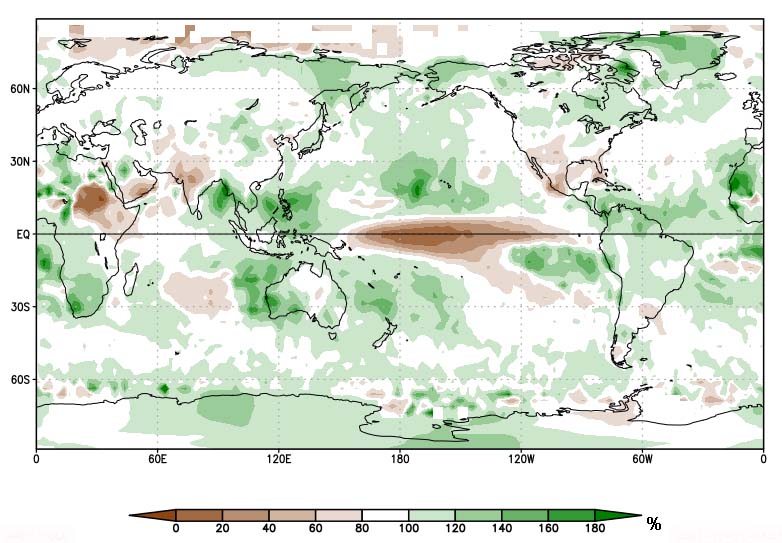
★エルニーニョ/ラニーニャ発生時の世界の降水量偏差図
エルニーニョ発生時の夏季(6月~8月)の世界降水量偏差図
エルニーニョ発生時の冬季(12月~2月)の世界降水量偏差図
ラニーニャ発生時の夏季(6月~8月)の世界降水量偏差図
ラニーニャ発生時の冬季(12月~2月)の世界降水量偏差図
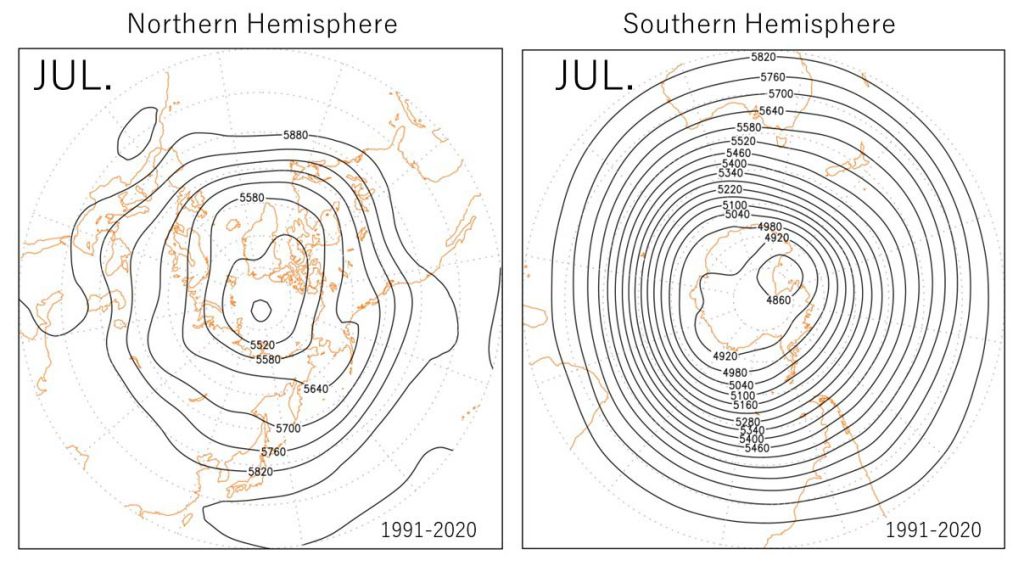
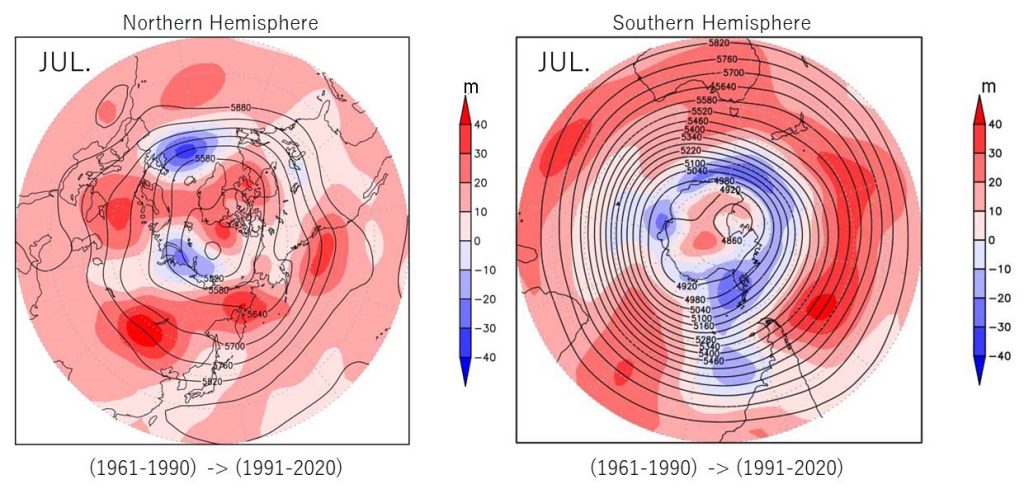
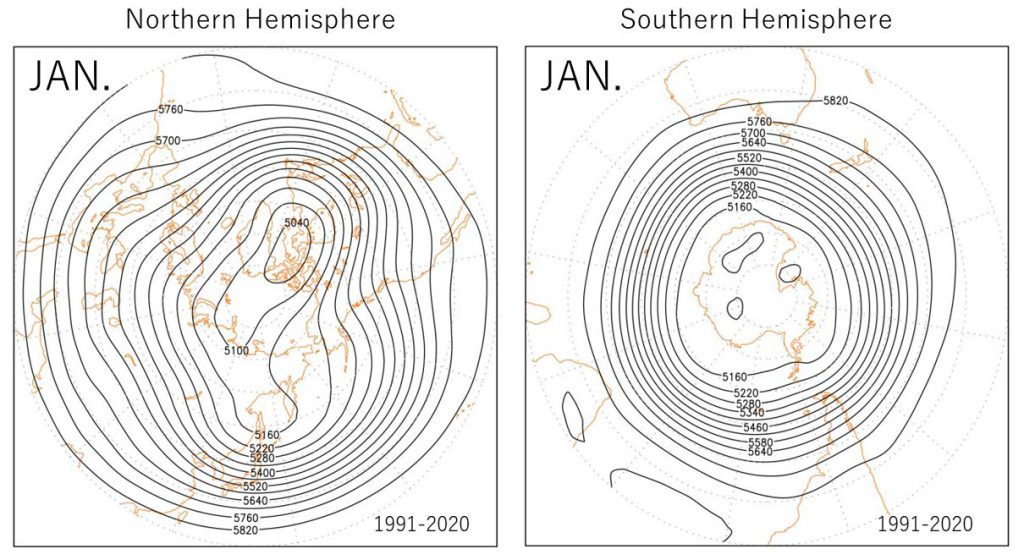
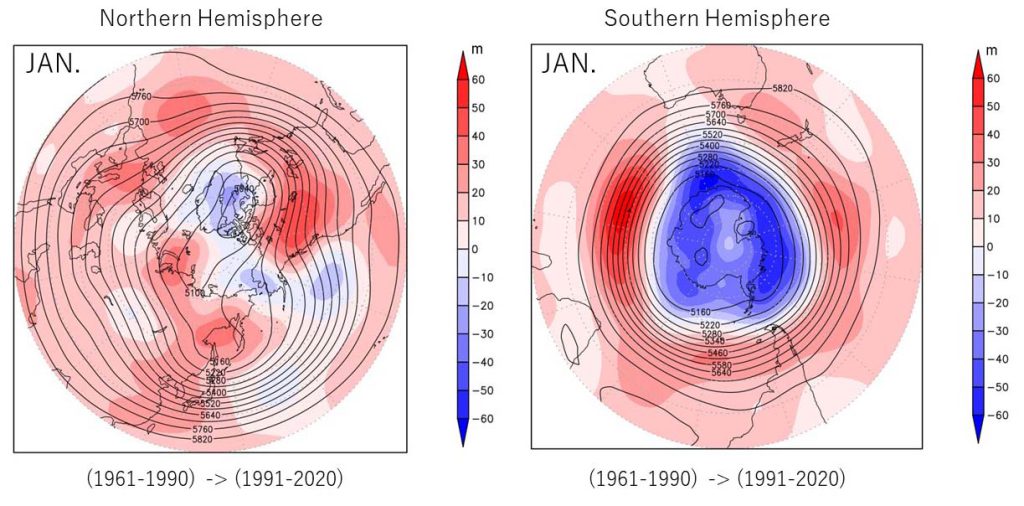
★北半球・南半球における1月・7月500hPa面平均高度分布(1991-2020平年値)および1961-1990平年値からの変化
1月の500hPa面高度分布(1991-2020平年値)
7月の500hPa面高度分布(1991-2020平年値)
このページでは、世界の気候アトラスを順次公開します。研究・教育用に使用される場合は、出典:JCDP (https://jcdp-jp/top-jp/) を明記して下さい。
世界の年平均気温分布(陸上):1981-2010
The data was acquired from GHCN Gridded V2 data provided by the NOAA/OAR/ESRL PSL, Boulder, Colorado, USA, from their Web site at / https://psl.noaa.gov/data/gridded/data.ghcncams.html
The figure was created using GrADS (The Grid Analysis and Display System).
世界の年降水量分布(陸上):1981-2010
The GPCC Precipitation data is provided by the NOAA/OAR/ESRL PSL, Boulder, Colorado, USA, from their Web site at https://psl.noaa.gov/data/gridded/data.gpcc.html/
The figure was created using GrADS (The Grid Analysis and Display System).
モンスーンアジアの1月降水量分布(陸上):1981-2010
The GPCC Precipitation data is provided by the NOAA/OAR/ESRL PSL, Boulder, Colorado, USA, from their Web site at https://psl.noaa.gov/data/gridded/data.gpcc.html/
The figure was created using GrADS (The Grid Analysis and Display System).
モンスーンアジアの7月降水量分布(陸上):1981-2010
エルニーニョ年とラニーニャ年の気候アトラス
エルニーニョ年とラニーニャ年における冬季(DJF:12月~2月)と夏季(JJA:6月~8月)の各種気候アトラス(平年1951-2020との差の合成平均図)を作成しましたので公開します。参考までに、冬季と夏季の海面水温分布図(1951-2020平均)も掲載しました。
NOAA ERSST v5をもとに作成
The NOAA ERSST v5 data is provided from their Web site at https://psl.noaa.gov/data/gridded/data.noaa.ersst.v5.html
The figure was created using GrADS (The Grid Analysis and Display System).
エルニーニョ年とラニーニャ年は、下記の気象庁の定義に従って抽出しました。
https://www.data.jma.go.jp/gmd/cpd/data/elnino/learning/faq/elnino_table.html
エルニーニョ年:
★冬季DJF 1951/52,1957/58,1963/64,1965/66,1968/69,1969/70,1972/73,1976/77,1982/83,1986/87,1987/88,1991/92, 1997/98, 2002/03,2009/10,2014/15,2015/16,2018/19
★夏季JJA 1951,1953,1957,1963,1965,1969,1972,1976,1982,1983,1987,1991,1992,1997,2002,2009,2014,2015
ラニーニャ年:
★冬季DJF 1954/55,1955/56,1964/65,1967/68,1970/71,1971/72,1973/74,1975/76,1984/85,1988/89,1995/96,1999/2000,2005/06,2007/08,2010/11,2017/18,2020/21
★夏季JJA 1954,1955,1964,1967,1970,1971,1973,1975,1984,1985,1988,1995,1998,2007,2010,2021954,1955,1964,1967,1970,1971,1973,1975,1984,1985,1988,1995,1998,2007,2010,2020
冬季DJF平均海面水温分布(1951-2020)
夏季JJA平均海面水温分布(1951-2020)
エルニーニョ年の冬季DJF海面水温SST偏差分布
エルニーニョ年の夏季JJA海面水温SST偏差分布
ラニーニャ年の冬季DJF海面水温SST偏差分布
ラニーニャ年の夏季JJA海面水温SST偏差分布
エルニーニョ/ラニーニャ発生時の世界の降水量偏差図(基準年:1979-2021)
The CPC Merged Analysis of Precipitation (CMAP) is provided from their Web site at https://psl.noaa.gov/data/gridded/data.cmap.html
The figure was created using GrADS (The Grid Analysis and Display System).
El Niño/ La Niña years are defined by the Japan Meteorological Agency. エルニーニョ年/ラニーニャ年は気象庁の定義による.
https://www.data.jma.go.jp/gmd/cpd/data/elnino/learning/faq/elnino_table.html
エルニーニョ発生時の夏季(6月~8月)の世界降水量偏差図
エルニーニョ発生時の冬季(12月~2月)の世界降水量偏差図
ラニーニャ発生時の夏季(6月~8月)の世界降水量偏差図
ラニーニャ発生時の冬季(12月~2月)の世界降水量偏差図
北半球・南半球における1月・7月500hPa面平均高度分布(1991-2020平年値)および 1961-1990平年値からの変化
Figures were created using GrADS (The Grid Analysis and Display System) based on NCEP Reanalysis data provided by the NOAA/OAR/ESRL PSL, Boulder, Colorado, USA, from their Web site at /https://psl.noaa.gov/data/gridded/data.ncep.reanalysis.html
1月の500hPa面高度分布(1991-2020平年値)
7月の500hPa面高度分布(1991-2020平年値)